Car crime in Camberley: 2026 figures
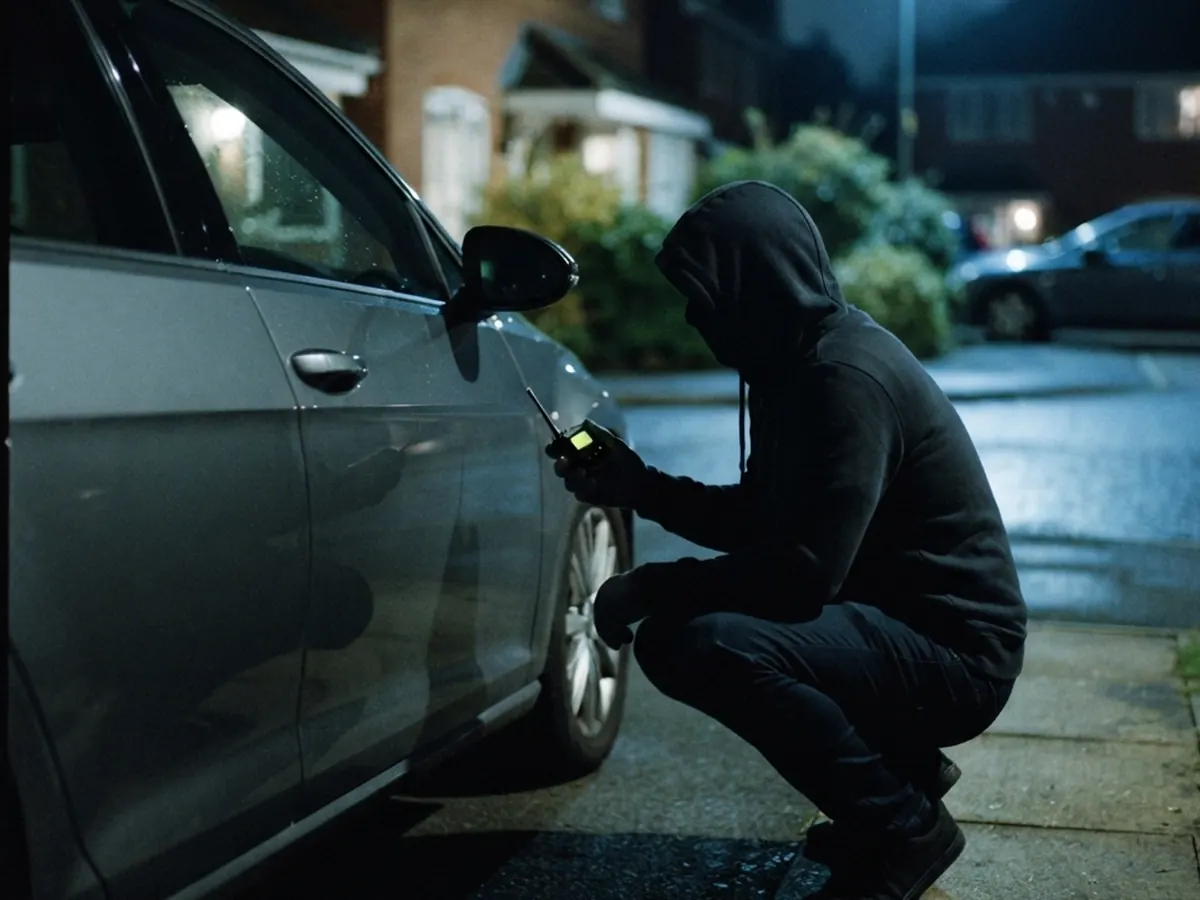
Camberley recorded 75 vehicle crimes in the 12 months to April 2026, a rate of 2.04 per 1,000 residents. That's below the Surrey rate of 3.63, and down 48% over three years.
The figures
| Area | Vehicle crimes (12 months) | Population (Census 2021) | Per 1,000 residents | 3-year trend |
|---|---|---|---|---|
| Camberley | 75 | 36,783 | 2.04 | down 48% |
| Frimley | 38 | 15,106 | 2.52 | not published |
| Sandhurst | 30 | 20,381 | 1.47 | down 24% |
| Surrey | 4,369 | 1,203,108 | 3.63 |
Source: CrimeRate, from police.uk data, 12 months to April 2026. Rates use Census 2021 populations for the Camberley and Frimley built-up areas (neither has a parish council) and Sandhurst parish (method). For your own street, search your postcode on police.uk.
Want the figures for your own street? Our free Car Crime Checker shows vehicle crime within a mile of any postcode, how it compares nationally, and how likely your car is to be stolen.
A big fall
Camberley's three-year drop is one of the largest of any town we cover. Sandhurst, just over the Berkshire border, is down 24%.
Falls like this can reverse just as quickly. Thieves go where the cars they want are parked, and those cars are still here.
What it means for you
It's a good time to be in Camberley. It's also the cheapest time to protect your car: before there's a reason to.
Protecting your car in Camberley
Stainless posts suit Camberley drives where looks matter. They stay bright without painting.
Cheap first steps: a signal-blocking pouch and a steering lock. More in our keyless theft guide.
Questions people ask
How does Camberley compare with nearby towns? Camberley's 2.04 per 1,000 is lower than its neighbours: Fleet 2.20, Wokingham 3.47, Farnborough 4.39 and Bracknell 5.61.
Do you fit in Camberley? Yes. We're about 25 minutes away by road, with no call-out charge. See our Camberley page for prices and the areas we cover.
Protect your car on the drive
Get your fixed, fitted price in 60 seconds and book your date online.